Utility Locating & Mapping

Utility Locating & Mapping

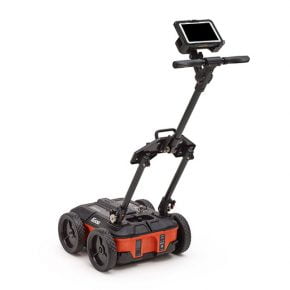
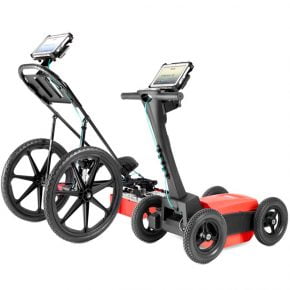
Utility locators, construction professionals, environmental firms and land surveyors need to know about underground assets prior to digging and trenching efforts. Learn more about how our ground penetrating radar (GPR) utility systems help locate and map metallic and non-metallic underground utilities and subsurface characteristics.
Utility locating
  • Utility Locating
  • Voids
  • Duct Banks
Utility Mapping and SUE
  • Utility Mapping
  • Subsurface Utility Engineering

Utility Locating Information

GSSI Utility Locating - Data Example 1

Locate and Map Underground Utilities

Contractors can mark out the depth and position of metallic and non-metallic pipes, and continuous plastic conduits such as gas and water lines, in real time using the GSSI UtilityScan products. GPR can enhance the overall understanding of subsurface targets and obstructions.

Taken at the GSSI utility test pit, this data illustrates 3 utility targets at various depths. These targets are metal, and this data was taken with the SIR 4000 and 400 MHz antenna. This data image highlights the marker input feature in the SIR 4000 control unit.

Utility Locating - Data Example 2

Locate Utilities with LineTrac

This data image was taken with the new UtilityScan and shows a target at 1m deep, target is electric utility with 60 Hz power detected. This data set highlights the LineTrac feature that is optional in the UtilityScan system.

Utility Locating - Data Example 3

Locate Duct Banks

Utilities encased in concrete and groupings of utilities can be located by using ground penetrating radar.

This 2D data set shows a duct bank with five utilities. Also shown is a well-defined excavation trench. This data was collected with the UtilityScan Pro with the 400 MHz antenna.

GSSI Utility Locating - Data Example 2

Identify Underground Voids

Construction professionals, engineers and transportation departments can identify and delineate voids under the surface of concrete and asphalt roadways with ground penetrating radar.

Data illustrates a well defined void underneath a reinforced concrete slab with an asphalt overlay. Note the small subsurface utilities in the bottom right of the data set. This data was taken with a SIR 4000 and 900 MHz antenna.

Utility Mapping Information

Map Mode

With Map Mode on UtilityScan, you can simultaneously pick targets and view their corresponding location on the GIS map shown on the right side of the screen. You can select the window size of the data and the map, or keep it split evenly as shown. The map shows an overview where the user located three different types of utilities. The dark green line represents the path that was taken when collecting the data.

Data on the left side of the screen shows a typical utility at 1.25m in depth and shows a nicely defined base layer at .4m in depth. The blue dot on the data image is a water line.

3D Image

On-screen 3D data collection mode allows you to define an area of interest. You can easily define the time slice depth and thickness in the field with the 3D data on the screen. The map window can be minimized to view your 3D display full screen.

Data image shows a horizontal yellow line that is a water line located at 1.25m in depth, collected with 3D mode.

This grid is 6×9 meters. The arrow on the left is the vertical position of the target. The + and – is how you control the thickness of the time slice.

Satellite & Aerial Imagery

UtilityScan software automatically saves a sample image (Target 1990 in the image below) for every target designated within the software. These in field targets can easily be exported into commonly available geo-browsers. These browsers can be used to create images for reports in the office or in the field.

Image shows a water line (blue), sewer line (green) and an electrical line (red). The yellow line is the GPS track taken by the user.